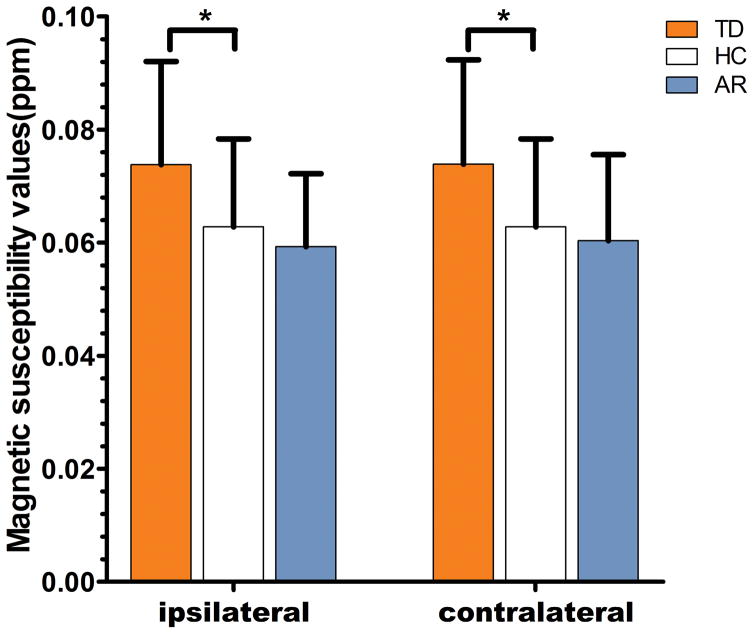
Figure 2.
Comparison of susceptibility values between ipsilateral or contralateral dentate nucleus in PD groups and pertinent mean values in bilateral sides of healthy controls, and Bonferroni correction was used for comparison between multiple groups. Significant differences between PD subgroups and control subjects are represented as: *p<.0167.

