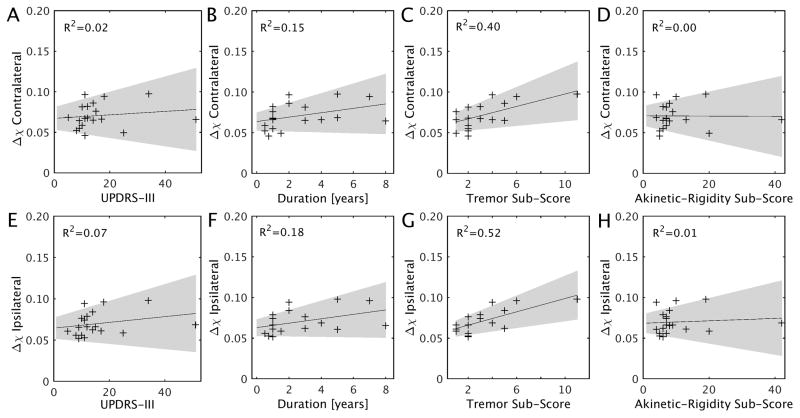
Figure 3.
Scatter plots and regression lines show the relationship between susceptibility values in bilateral DN and clinical measures in drug naive PD patients. The shaded region in each plot shows the 95% confidence interval. Correlations are partialed for gender, age, and education. P-value threshold for significance is 0.00357 adjusted based on Bonferroni correction.

