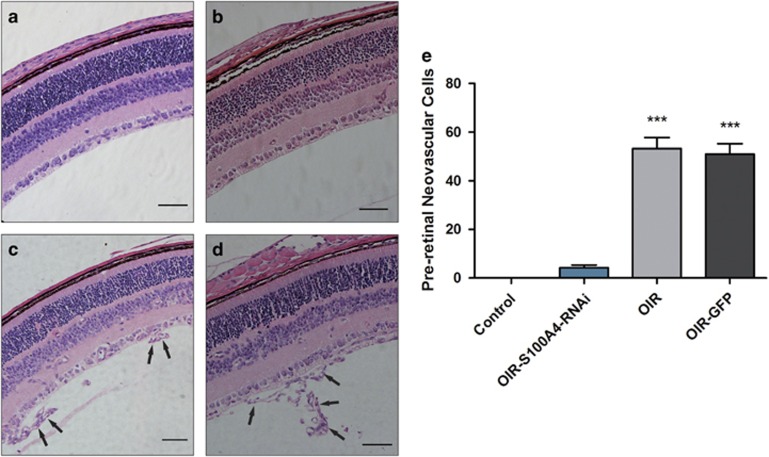
Figure 4.
Number of vascular cell nuclei on the vitreal side of the internal limiting membrane in the different groups. The eyeballs from the control group, OIR-S100A4-RNAi group, OIR group, and OIR-GFP group were fixed, sectioned, and stained with H&E. (a) Control group; (b) OIR-S100A4-RNAi group; (c) OIR group; (d) OIR-GFP group. Arrows indicate pre-retinal neovascularization cells; 200 × magnification. (e) The average numbers of pre-retinal neovascularization cells (mean±SD) of the control group, OIR-S100A4-RNAi group, OIR group, and OIR-GFP group were analysed using a one-way ANOVA test. OIR-S100A4-RNAi group vs OIR group, ***P<0.05; OIR-S100A4-RNAi group vs OIR-GFP group, ***P<0.05.

