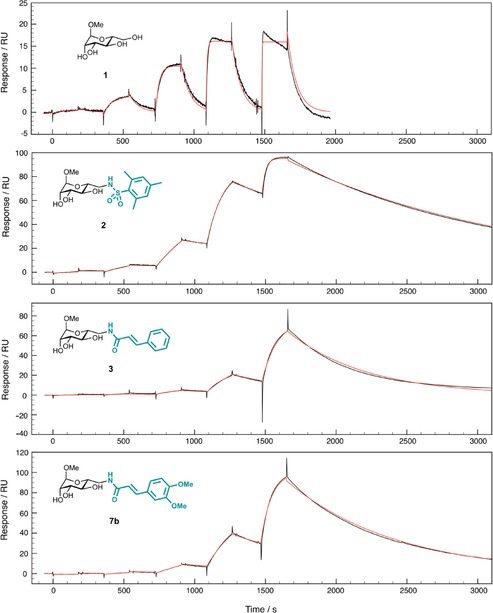
Figure 5.

Single cycle kinetics analysis by surface plasmon resonance (SPR) of the direct binding of 1, 2, 3, or 7 b to immobilized LecB. Experimental data are shown in black; calculated fits using a 1:1 binding model with a global fitting on all injected concentrations are shown in red. Ligand concentrations injected were 120 nm, 600 nm, 3 μm, 15 μm, and 75 μm for 2, 3, and 7 b, and 3 μm, 15 μm, 75 μm, 375 μm, and 1.8 mm for 1.
