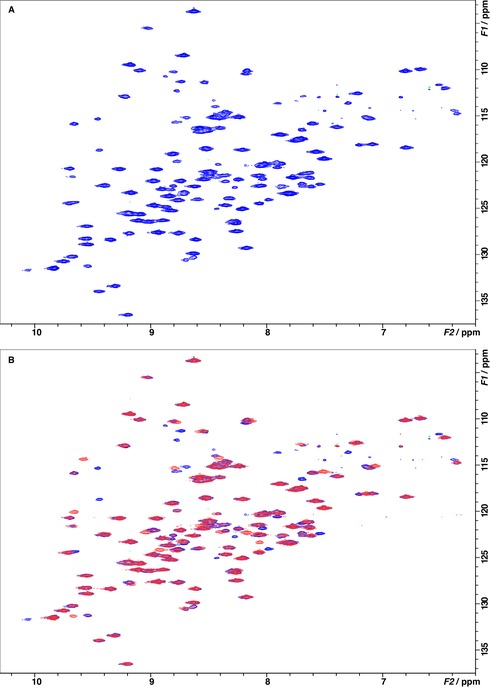
Figure 7.

Binding of dimethoxycinnamide 7 b to LecB was analyzed by 1H,15N‐TROSY‐HSQC NMR experiments in the absence (blue) and presence (red) of 7 b. A) Spectrum of 500 μm 15N‐labeled LecB without addition of ligand. B) Spectrum of 500 μm 15N‐labeled LecB in the absence (blue) and in presence (red) of 1 equivalent 7 b. Upon addition of 7 b, the intensities of about 15 peaks decreased, and a number of new crosspeaks appeared. This is indicative of chemical shift perturbations of a defined binding that interacts with 7 b in the slow‐exchange regime.
