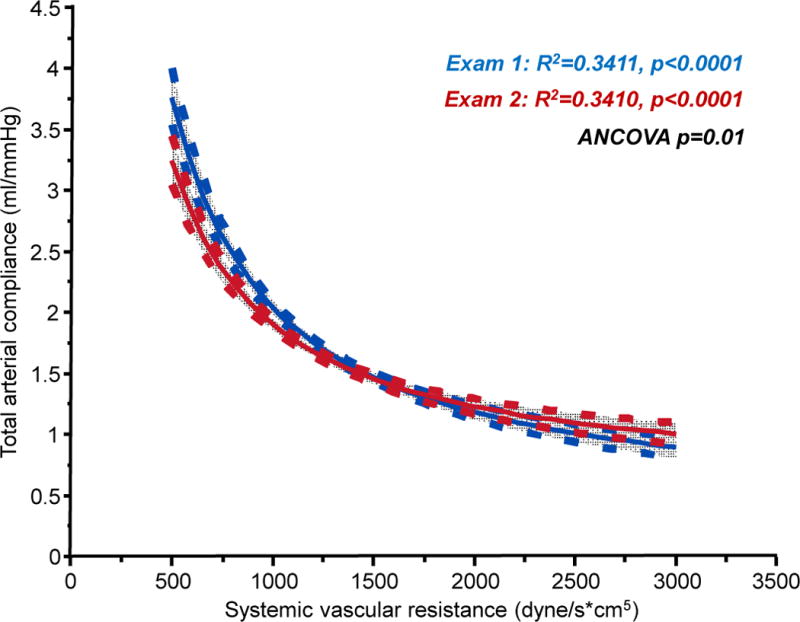
Figure 1.

Plot of total arterial compliance versus systemic vascular resistance at examination 1 (blue) and examination 2 (red) showing mean regression lines and 95% CI of the mean. P value reflects ANCOVA comparing the two relations after log-log transformation.
