
Figure 4.
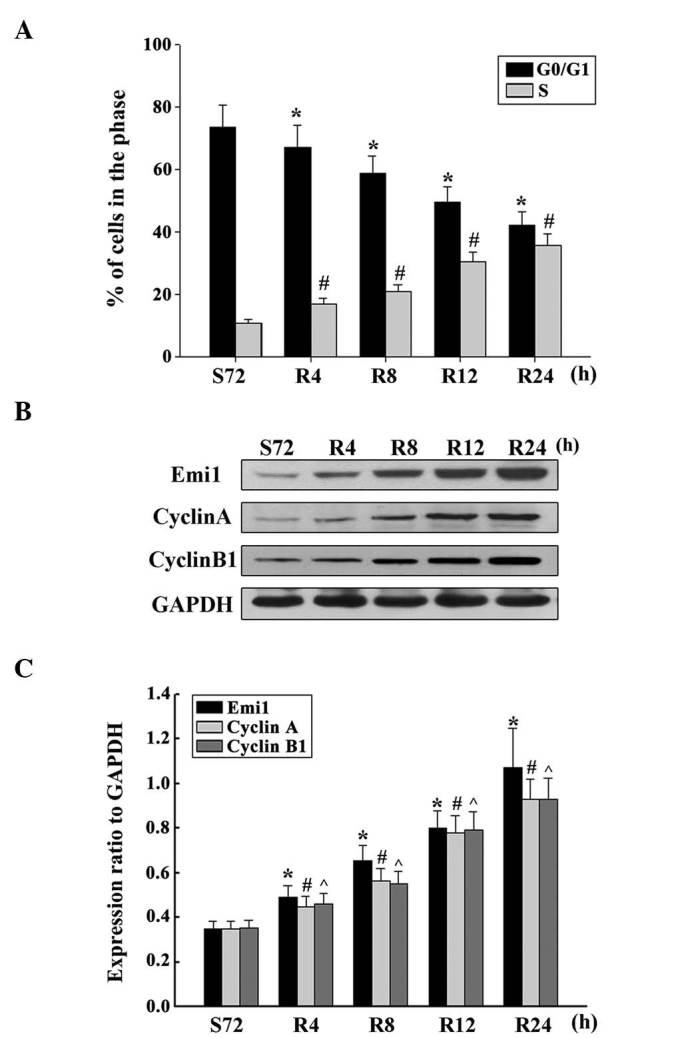
Overexpression of Emi1 and cell cycle-related molecules in proliferating esophageal squamous cell carcinoma cells. (A) ECA109 cells were synchronized at G1, and induced to progress into the cell cycle by serum addition at 0, 4, 8, 12 and 24 h. Upon cell cycle progression induction, the majority of cells were in the S phase. Data represent the mean ± standard deviation of three independent experiments *,#P<0.01 vs. control (S72 h). (B) ECA109 cells were serum starved for 72 h, and following serum addition, cell lysates were prepared and analyzed by western blotting using antibodies against Emi1, cyclin A and cyclin B1. GAPDH was used as a control for protein loading and integrity. (C) Ratio of Emi1, cyclin A and cyclin B1 protein levels to those of GAPDH for each time point, as analyzed by densitometry. Data represent the mean ± standard error of the mean (n=3). *,#,^P<0.01, vs. control (S72 h). S, serum starvation; R, serum addition; Emi1, early mitotic inhibitor-1; GAPDH, glyceraldehyde 3-phosphate dehydrogenase.