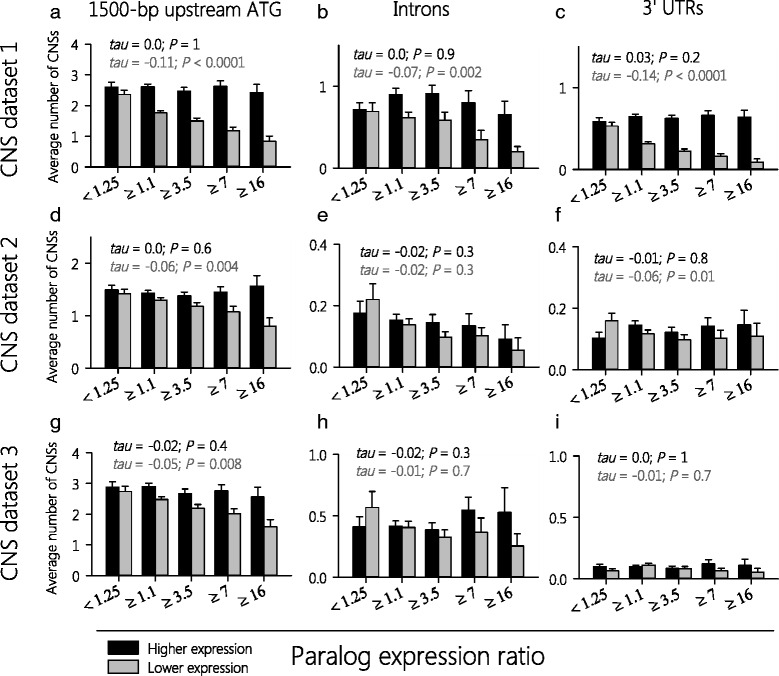
Fig. 4.

With increasing expression divergence, lower-expressed paralogs have fewer CNSs in their promoters, introns, and 3′ UTRs. The two genes of each paralogous pair were classified as higher-expressed (black bars) or lower-expressed (grey bars) paralog, and plotted according to their ratio in gene expression levels (based on log2-values). Y-axes show the average number of CNSs within promoters (1500-bp upstream ATG -100 bp) (a, d, g), introns (b, e, h), and 3′ UTRs (c, f, i). Three different CNS datasets were analyzed [38–40]. A significant negative correlation between the paralog expression ratio and number of CNSs in promoters (Kendall rank correlation) was found for the lower expression group in all datasets. A correlation between paralog expression ratio and number of CNSs in introns or 3′ UTRs was limited (b, c, f). The higher expression group had no significant correlation with the number of CNSs. Error bars are given as s.e.m
