Fig. 5.

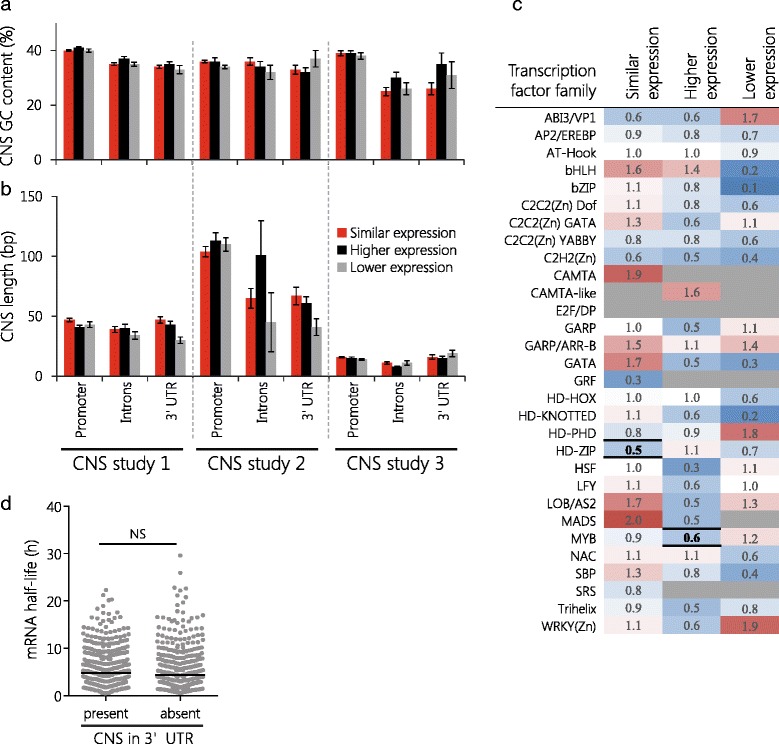
Length, GC content, transcription factor binding sites, and effect on mRNA half-life are similar for CNSs at paralogs. GC content (a) and length (b) of CNSs from three datasets are compared between paralogs with similar (red), higher (black), or lower (grey) expression in promoters, intronic regions, and 3′ UTRs. No statistically significant differences were found (resampling without replacement, 1000 iterations). Error bars are given as s.e.m. c Transcription factor binding site enrichment (red) and depletion (blue) within CNSs located in promoter regions is shown. CNSs are from CNS dataset 1. Missing values (grey) indicate complete absence of the transcription factor binding site motif from CNSs in the respective paralog group. Significant depletion was found for MYB binding site motifs in the higher expression group and HD-ZIP binding site motifs in the similar expression group (resampling without replacement, 1000 iterations; P < 0.01). d Paralogs with no (absent) or at least one (present) CNS in their 3′ UTRs show no difference in mRNA half-lives (Wilcoxon signed-rank test; black line indicates median value). NS = not significant
