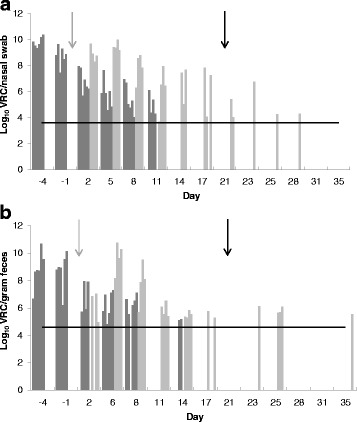
Fig. 3.

Log10 viral RNA copies (VRC) of BCoV per nasal swab (a) and gram feces (b). Shedding of BCoV from calves in the Field group (FG) (dark grey) and in the Exposed group (EG) (light grey). Grey arrow; day of EG and FG commingling. Black arrow; day of Sentinel group and EG commingling. The horizontal lines show the limit of quantification of VRC
