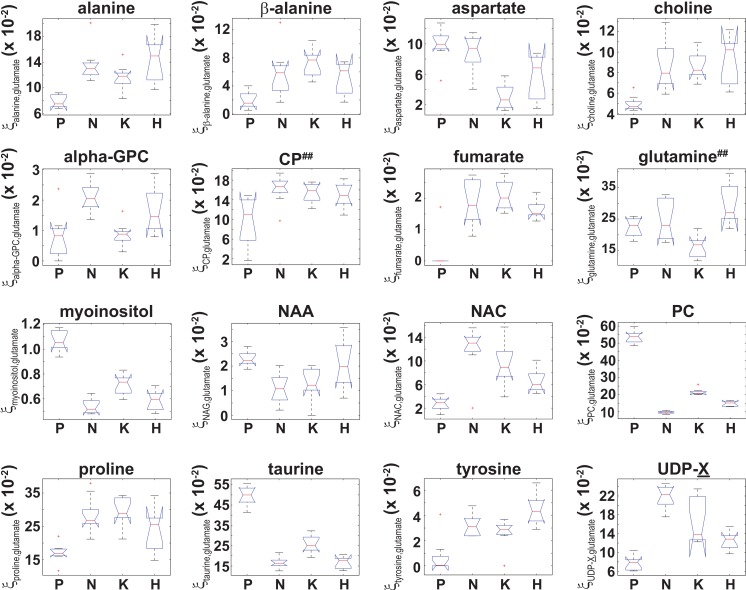
Figure 5. Box plots of the glutamate normalized signals identified by ANOVA analysis.
Box plots of for those 16 metabolites that were identified by an ANOVA analysis that indicated was unequal between at least two of the four cell types. While the ANOVA analysis identified both and , post-hoc/multiple comparison testing could not identify any significant differences in either and between the cell lines, which is denoted by the superscript ‘##’.

