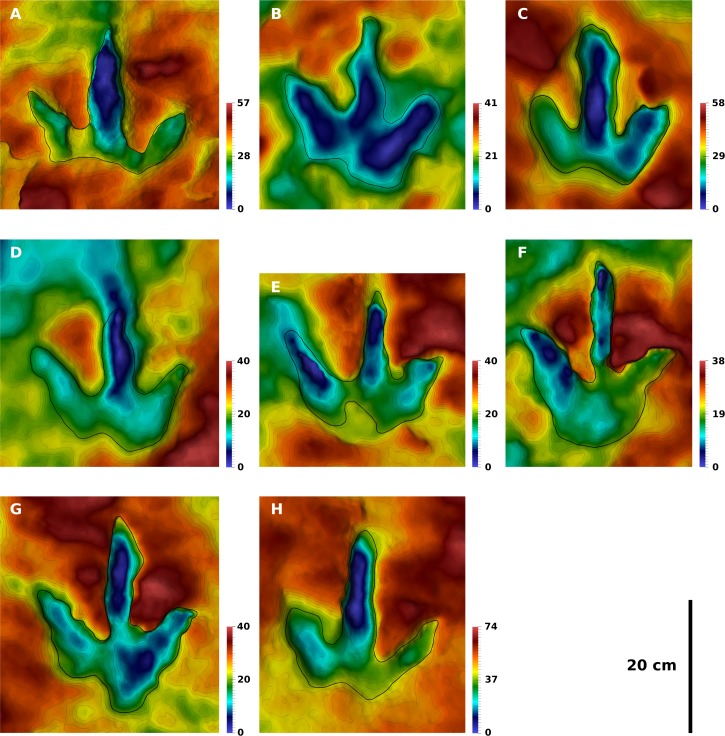
Figure 6. Contoured depth-color images with interpretative outlines of the eight footprints of the T2 trackway analyzed herein.
All footprints are to scale, and all left footprints were mirrored to fit the right ones. The color scale ranges from the lowest point (blue) to the highest point of the model (red); given the different depths in separate models, the depth of a specific color varies. (A) T2/01. (B) T2/11. (C) T2/12. (D) T2/13. (E) T2/14. (F) T2/21. (G) T2/22. (H) T2/24. Color legend scales in mm.

