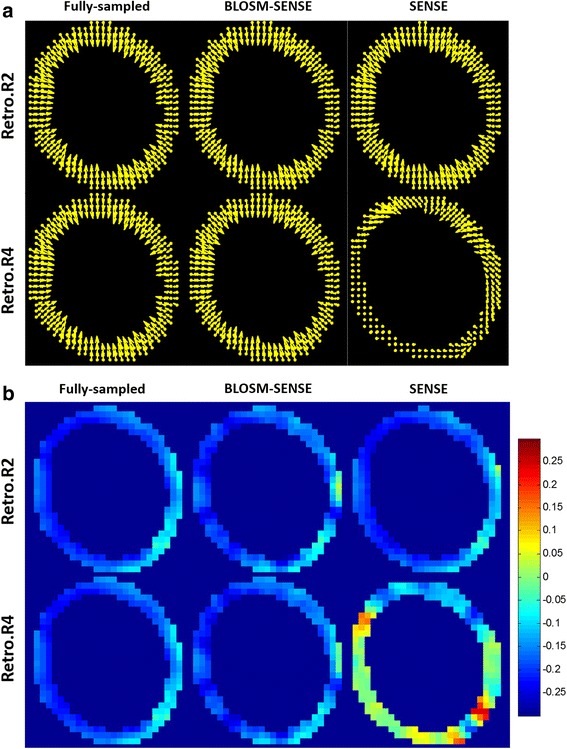
Fig. 10.

Example displacement and Ecc maps at end-systole from one volunteer. Displacement maps (a) and Ecc maps (b) calculated from different methods (columns) and retrospective acceleration rates (rows) are shown. At rate-2, both methods present similar values and patterns to the fully-sampled reference. At rate-4, only BLOSM-SENSE provided accurate displacement and strain assessments
