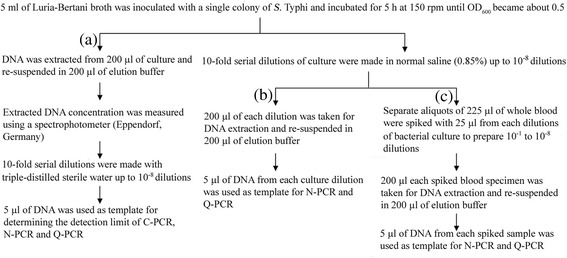
Fig. 1.

Flow chart showing methods for determination of analytical sensitivities of C-PCR, N-PCR and Q-PCR under laboratory condition. Three (a, b, c) categories of extracted DNA were used to determine the DNA detection limits. Bacterial culture showing one OD (at 600 nm) is equivalent to 8 × 10⁸ organisms/ml
