Fig. 2.

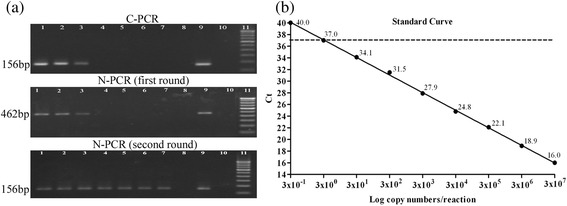
a Agarose gel (2 %) showing DNA detection limits of C-PCR and N-PCR by amplifying fliC-d gene for typhoid diagnosis. Lane 1 to lane 8, diluted bacterial DNA (10-fold) from 3 × 10⁶ to 3 × 10⁻¹copies/reaction;lane 3, 3 × 10⁴copies/reaction (sensitivity of C-PCR); lane 7, 3 × 100copies/reaction (sensitivity of N-PCR); lane 9, positive control (S. Typhi CT18); lane 10, negative control (sterile distilled water); lane 11, 100-bp DNA ladder marker. b Determination of analytical sensitivity of Q-PCR. A standard curve was generated by plotting the threshold cycles (Ct) values on y axis and DNA copy numbers/reaction on x axis. The dashed line indicates the Ct cutoff value of ≤37 at 3 × 100 copies/reaction (sensitivity of Q-PCR)
