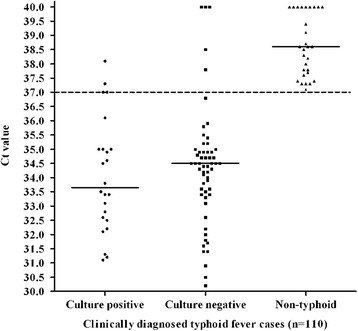
Fig. 3.

Distribution of Ct values by Q-PCR in blood culture positive typhoid (n = 24), culture negative typhoid (n = 57) and non-typhoid (n = 29) cases among the study subjects. The dashed line indicates the Ct cutoff value of ≤37 determining positive test by Q-PCR. The solid lines indicate the median Ct values for each group
