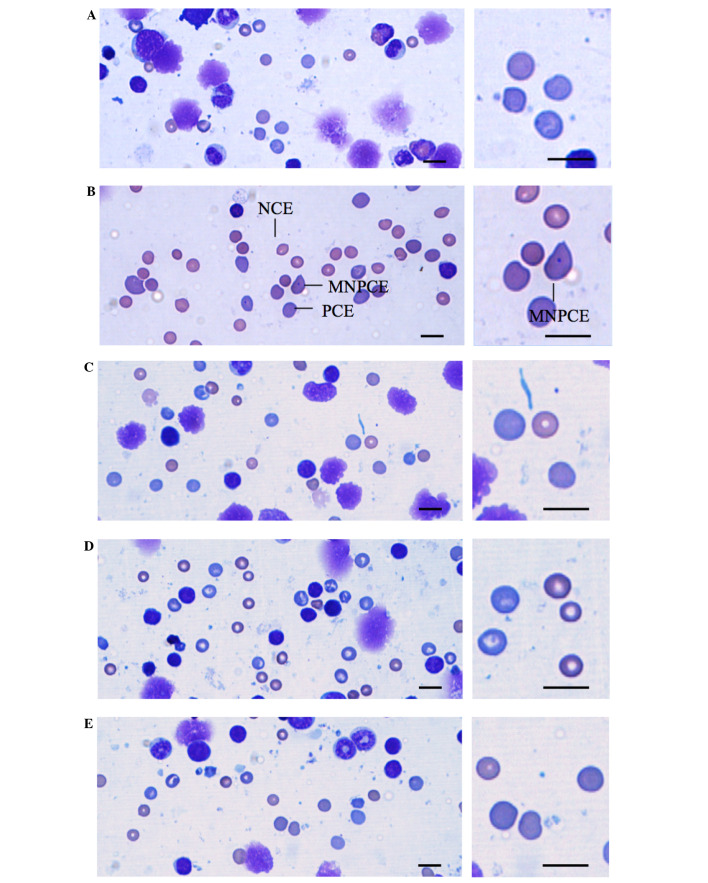
Figure 2.
Representative cytology of bone marrow cell smears of mice treated with (A) vehicle, (B) CPA, (C) 2,000 mg/kg PR extract, (D) 1,000 mg/kg PRextract and (E) 500 mg/kg PR extract. In the prepared bone marrow cell smears, PCEs, NCEs and MNPCEs were counted on the basis of morphology. NCEs containing nuclei were not calculated. Significant (P<0.01) increases of the numbers of MNPCEs among 2,000 PCEs were detected in the CPA group as compared with the vehicle control, but no notable changes in MNPCE numbers were observed for mice treated with any of the three doses of PR extract when compared with the vehicle control. Although PCE numbers in the 70 mg/kg CPA-treated mice were significantly (P<0.01) decreased as compared with the vehicle control, individual PCE/(PCE + NCE) ratios were >0.25. No significant changes on the PCE/(PCE + NCE) ratio were observed for mice treated with any of the three PR extract doses as compared with the vehicle control. CPA, cyclophosphamide; PR, Persicariae Rhizoma; PCE, polychromatic erythrocyte; NCE, normochromatic erythrocyte; MNPCE, micronucleated bone marrow polychromatic erythrocytes. Scale bar, 5 µm.

