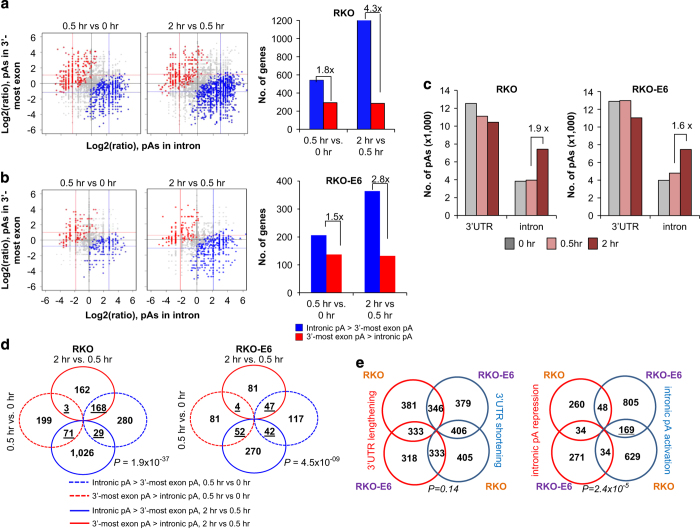
Figure 2.
Regulation of intron-APA in both RKO and RKO-E6 cells after UV treatment. (a, b) Comparison of expression between intronic pA isoforms and all isoforms using pAs in the 3ʹ-most exon in RKO and RKO-E6 cells. Blue dots correspond to genes with upregulated proximal pA isoform (intronic pA activation) and red dots correspond to genes with upregulated distal pA isoform (intronic pA repression). Grey dots are genes that have no significant regulation. Colored lines indicate median values for blue or red dots. Number of genes with significantly regulated intron-APA events is shown on the right. Ratio of number of genes in the blue bar to that of genes in the red bar is indicated. (c) Distribution of pAs detected in 3ʹUTRs or introns in samples from both RKO and RKO-E6 cells. Only pAs with read number greater than 5% of all reads of the gene were used. (d) Venn diagram comparing genes with significantly regulated intronic pA isoforms in two windows in samples from both RKO and RKO-E6 cells. (e) Venn diagram comparing significantly regulated APA events in RKO and RKO-E6 cells. Significance was determined by RED (relative expression difference), with the cutoff of >1 or <−1. (left) 3ʹUTR-APA events. (right) intron-APA events. Statistical analysis of overlapping genes was performed by the Fisher’s exact test. APA, alternative cleavage and polyadenylation; 3′READS, 3′ region extraction and deep sequencing; UTR, untranslated region; UV, ultraviolet.

