
Fig. 2.
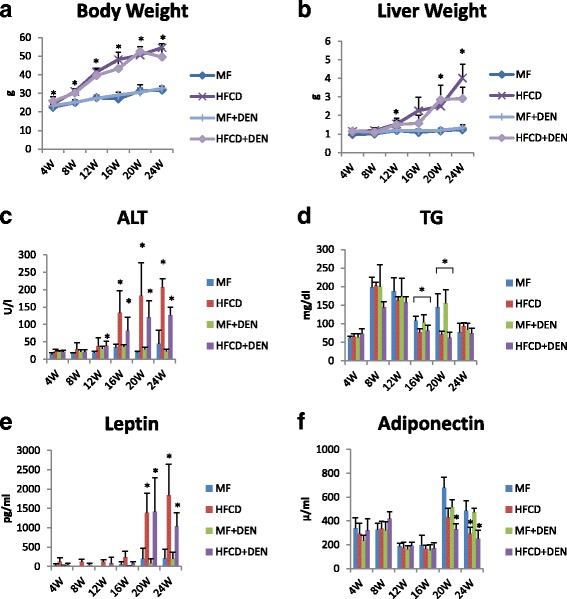
Body and liver weights and laboratory findings: a body weight; b liver weight; c plasma alanine aminotransferase (ALT); d plasma triglycerides (TG); e plasma leptin; and f adiponectin. The data are shown as the mean + standard deviation. * p < 0.05 indicates a significant difference between the standard diet (MF) group and the other groups for each month. HFCD, high-fat choline-deficient diet; DEN, diethylnitrosamine