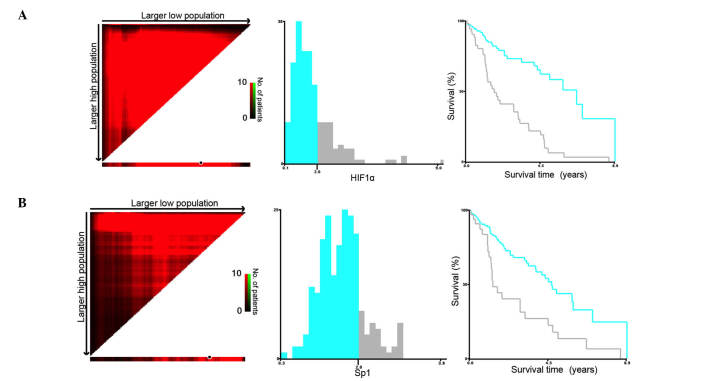
Figure 1.
X-tile analysis of survival data for (A) HIF1α and (B) Sp1 expression levels from The Cancer Genome Atlas registry. X-tile analysis was performed on patient data from the Surveillance, Epidemiology, and End Results Program registry, which was equally divided into training and validation sets. X-tile plots of training sets are presented in the left panels, with plots of matched validation sets shown in the smaller inset. The construction of X-tile plots is more fully described in previous articles (13). The optimal cutoff point highlighted by the black circle in the left panels is shown on a histogram of the entire cohort (middle panels), and a Kaplan-Meier plot (right panels). P-values were determined by using the cutoff point defined in the training set and applying it to the validation set. Figures shows HIF1α and Sp1 divided at the optimal cutoff point (2, χ2=116.376, P<0.001). HIF1α, hypoxia-inducible factor 1α; Sp1, transcription factor specificity protein 1.

