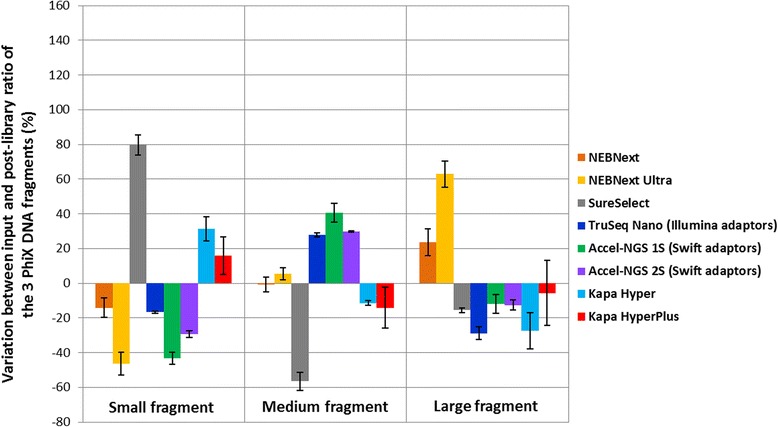
Fig. 5.

Bar chart representing the percentage of variation between the 3 different PhiX fragments before and after library preparation with the different kits tested. For each sample, the molar concentration of the 3 PhiX fragments was estimated before and after library preparation on a Bioanalyzer chip. The ratio between the 3 fragments before library prep was close to 33 % for each, but important variations were observed after library preparation. Here we plotted the difference between the pre- and post-library preparation ratio as a percentage. All the libraries were prepared using the original Illumina Paired end adaptor [6, 22] except for the Truseq Nano kit and the Swift kits
