Fig. 2.

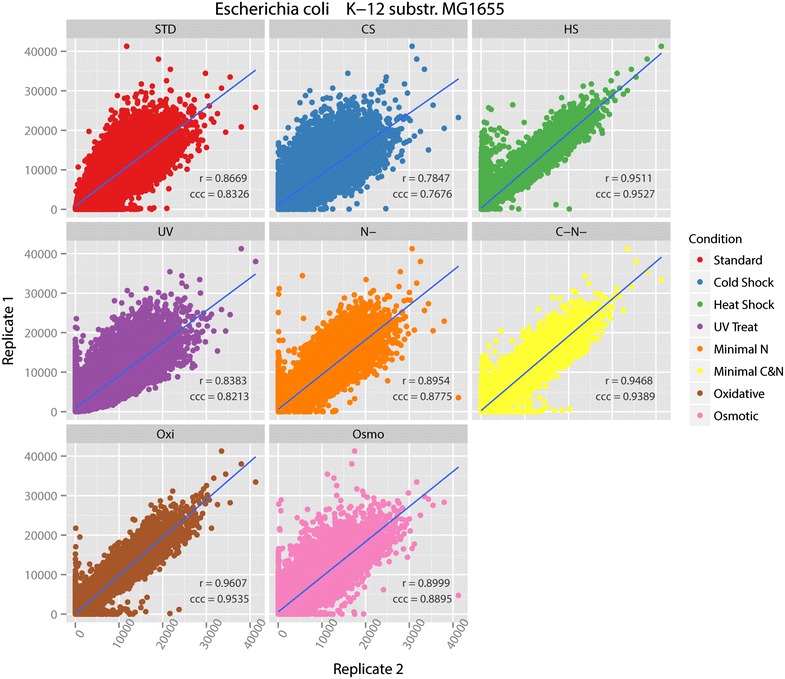
Scatterplots with correlation values for 8 treatment replicate pairs of MG1655. On the graphs, ‘r’ denotes Spearman’s correlation and ‘ccc’ denotes concordance correlation coefficient

Scatterplots with correlation values for 8 treatment replicate pairs of MG1655. On the graphs, ‘r’ denotes Spearman’s correlation and ‘ccc’ denotes concordance correlation coefficient