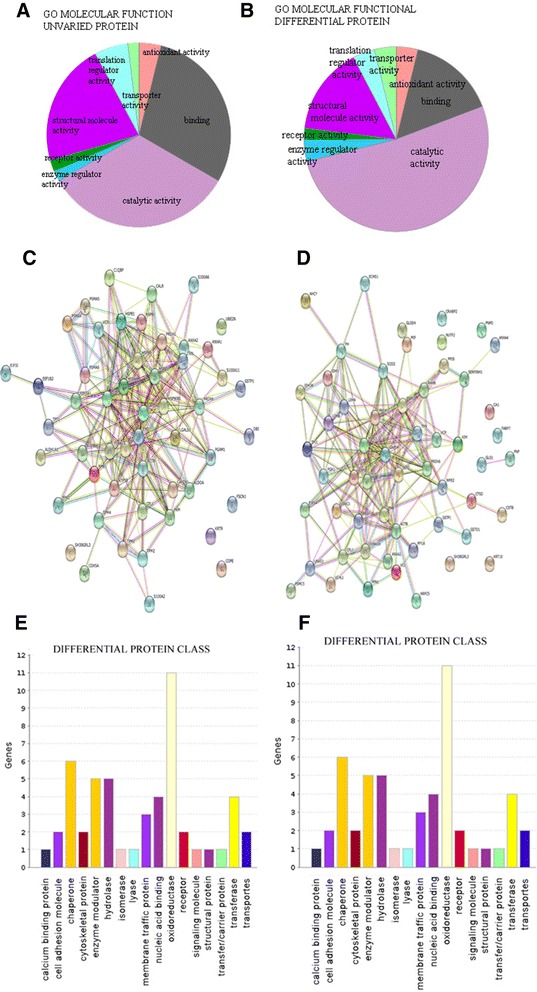
Fig. 5.

Pie charts representing the GO molecular function of unvaried proteins a and differential expressed proteins b. Protein network of f-LSC unvaried proteins c and differential expressed proteins, performed on the STRING website d. Protein class distribution of unvaried e and differential expressed proteins f, performed on the Gene Ontology website
