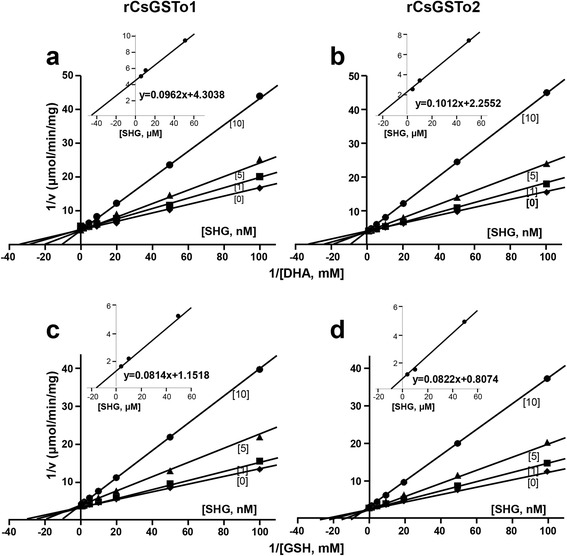
Fig. 3.

Steady-state kinetics of S-hexylglutathione (SHG) against rCsGSTo1 and 2. Lineweaver-Burk plot of inhibition mode of initial velocities of rCsGSTo1 and 2. a, b Activities (1/v) versus 1/[DHA] (mM-1) or rCsGSTo1 and 2. c, d Activities (1/v) versus 1/[GSH] (mM-1) in the absence (diamond) and presence of 1 nM (rectangle), 5 nM (triangle) and 10 nM (circle) of SHG. Variable concentrations of DHA and GSH from 0.01 to 100 mM were applied. Data are plotted in double reciprocal form. Insets show secondary plot of the 1/Vmax values obtained from the primary Lineweaver-Burk plot versus SHG concentration for the determination of Ki value. All assays were independently done in triplicate (n = 3, mean ± standard deviation, SD) and representative figures are shown
