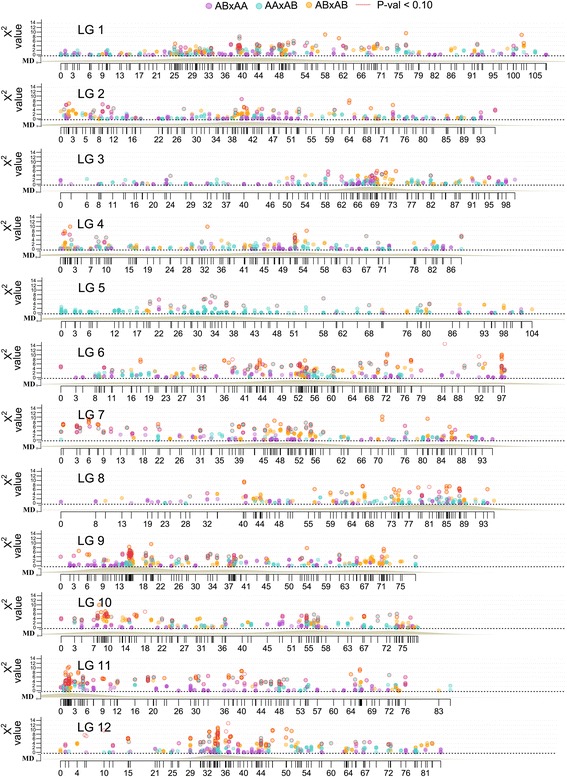
Fig. 3.

Cranberry linkage map marker density/depth and genome-wide patterns of segregation distortion. Segregation distortion is plotted as a function of Chi-squared value (y axis) for monogenic marker segregation ratios against marker position on each of the twelve LGs of the integrated map. Uniparental markers for P1 (female is heterozygote) are indicated with pink, uniparental markers for P2 (male is heterozygote) are displayed in light blue, whereas biparental markers (both parents heterozygotes) are shown in gold dots. Dots with red halo indicate markers with Chi-squared values significant at p-values ≤ 0.10. Genetic distances are displayed in cM on the x axis. MD label on the y axis refers to marker density across the linkage group
