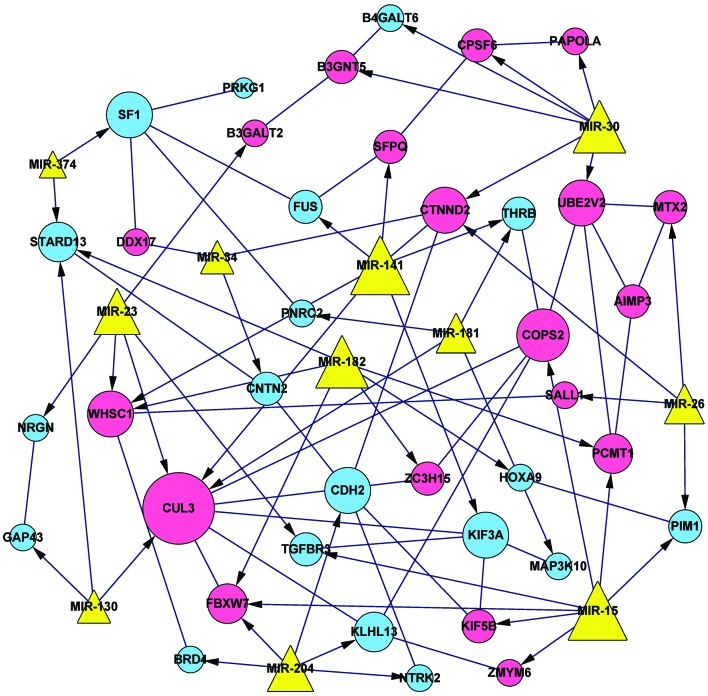
Figure 1.
Integrated microRNA (miRNA)-differentially expressed gene (DEG) network. Circular nodes represent DEGs (pink circles, upregulated genes; blue circles, downregulated genes). Yellow triangles represent the miRNAs, with edges with arrowheads depicting associations between miRNAs and DEGs, and edges with lines depicting protein-protein interactions between the DEGs.

