
Figure 1.
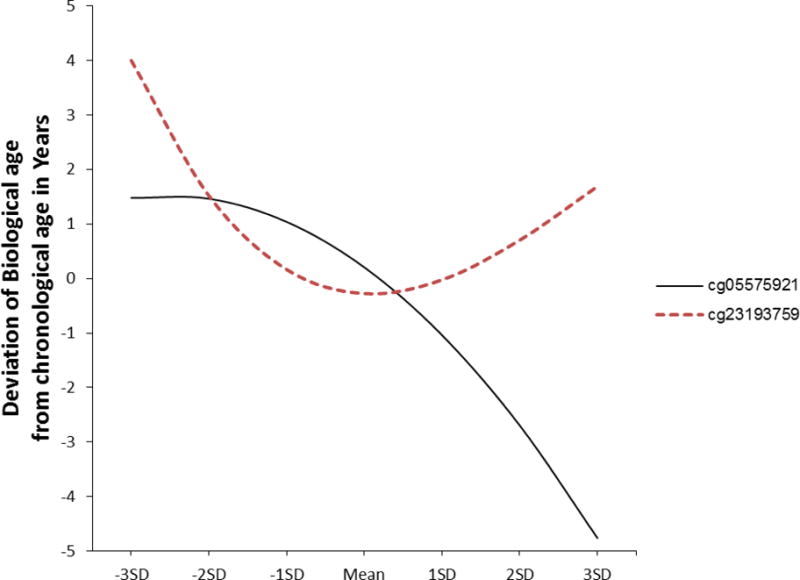
Graph of the best-fitting model representing the effect of smoking consumption (solid line; cg05575921) and alcohol consumption (dotted line; cg23193759) on biological aging using Hannum’s weights. All values within ±3 standard deviations of the mean of each predictor are included. In each case, lower scores on the x-axis indicate greater substance use exposure, and higher scores on the y-axis indicate relatively greater acceleration of the biological clock. Predicted scores represent residual biological age after controlling for chronological age.