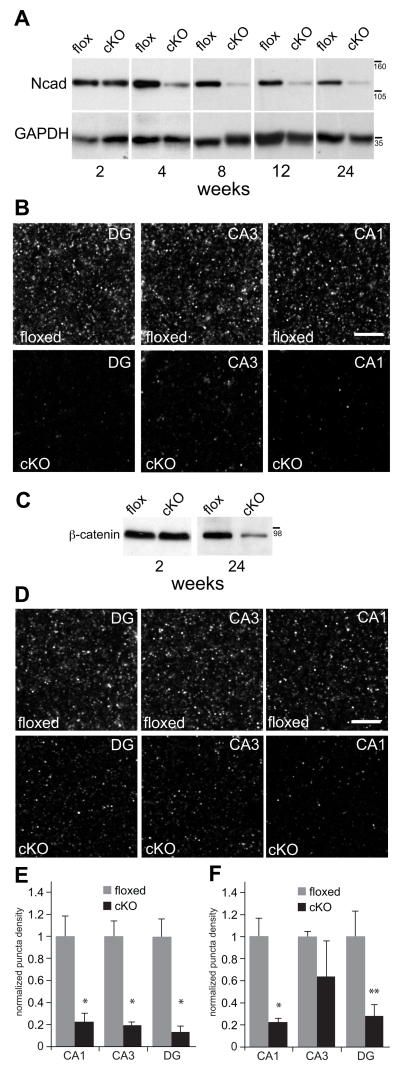
Fig. 2. N-cadherin is ablated and ß-catenin levels are diminished in N-cadherin cKO mice.
A) Representative western blots of N-cadherin (Ncad) and GAPDH (used as a loading control) prepared from whole-hippocampal lysates at postnatal weeks indicated. There were no significant differences in N-cadherin levels across ages in the floxed control mice (p > 0.6, n=3 mice per genotype per age). At 2 postnatal weeks, N-cadherin levels in cKO mice were indistinguishable from those in control mice (p > 0.5). However, in comparison with age-matched floxed controls, N-cadherin levels in the cKO mice declined significantly by 4 postnatal weeks and remained significantly lower thereafter (p < 0.01). Statistical comparisons across ages were assessed using one-way ANOVA. Numbers (on right) indicate approximate positions of molecular mass markers (kDa).
B) Representative patterns of N-cadherin immunolocalization in stratum radiatum (CA1 and CA3) or the molecular layer of the dentate gyrus (DG) of adult (5 mo-old) hippocampus. Bar = 5 μm.
C) Representative western blots of ß-catenin and GAPDH (used as a loading control) prepared from whole-hippocampal lysates at postnatal weeks indicated. There were no differences between genotypes in ß-catenin levels at 2 postnatal weeks (p > 0.6, n=3 mice per genotype per age), but by 24 weeks, ß-catenin levels were significantly diminished in the cKO hippocampus in comparison with floxed controls (p < 0.05). Statistical comparisons across ages were assessed using one-way ANOVA. Numbers (on right) indicate approximate positions of molecular mass markers (kDa).
D) Representative patterns of ß-catenin immunolocalization in stratum radiatum (CA1 and CA3) or the molecular layer of the dentate gyrus (DG) in adult (5 mo-old) hippocampus. Bar = 5 μm.
E) Quantitative analysis of N-cadherin puncta density confirmed a significant decrease in the cKO mice in comparison with floxed controls across all subfields (*p < 0.01, n=8 mice per genotype, unpaired Student’s t-test).
F) Quantitative analysis of ß-catenin puncta density confirmed a significant decrease in the cKO mice in comparison with floxed controls in CA1 (*p < 0.01) and DG (**p < 0.05), but not in CA3 (p=0.33; n=4 per genotype, unpaired Student’s t-test). In E and F, all quantitative values for each hippocampal subfield were normalized to floxed control values for that subfield.

