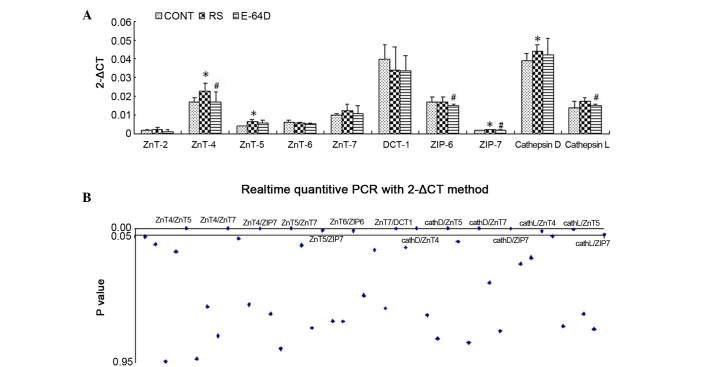
Figure 3.
mRNA expression levels as identified using reverse transcription-quantitative polymerase chain reaction analysis. (A) Expression of ZnT-2, ZnT-4, ZnT-5, ZnT-6, ZnT-7, DCT-1, ZIP-6, ZIP-7, cathepsin D and cathepsin L in the rat hippocampus after behavioral analysis. (B) Pearson's linear correlation analyses of the ten genes. Data are expressed as the mean ± standard deviation. Data was analyzed with post hoc comparisons using a Bonferroni test after analysis of variance. *P<0.05 vs. CONT group; #P<0.05 vs. RS group. CONT, control group; RS, recurrent seizure group; E64D, E-64d-treated group; Znt, zinc transporter; DCT-1, divalent cation transporter 1; ZIP, Zrt-Irt-like protein.

