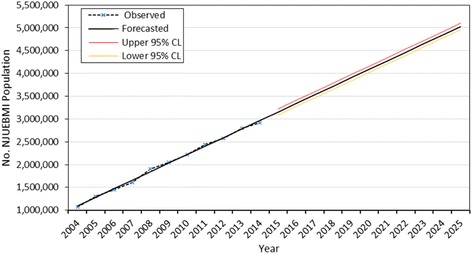
Fig. 1.

Forecasted NJUEBMI population counts according to the linear trend model. The asterisk and dashed line represent the observed data, the solid line indicates the forecasted counts, and the lines above and below the solid line from 2015 to 2025 indicate the upper and lower 95 % confidence limits (CL), respectively, for the forecasted counts
