Fig. 4.

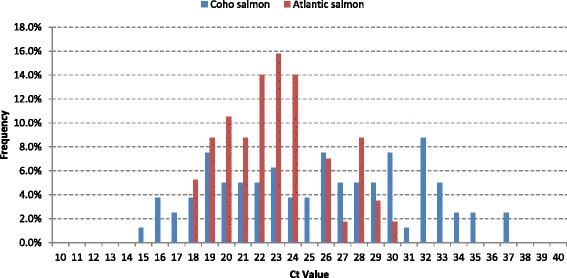
Frequency distribution of the cycle threshold (Ct) values for all farms positive for PRV. The PRV positive Atlantic salmon (n = 57) are shown in red, and the PRV positive coho salmon (n = 80) are shown in blue

Frequency distribution of the cycle threshold (Ct) values for all farms positive for PRV. The PRV positive Atlantic salmon (n = 57) are shown in red, and the PRV positive coho salmon (n = 80) are shown in blue