Figure 3.
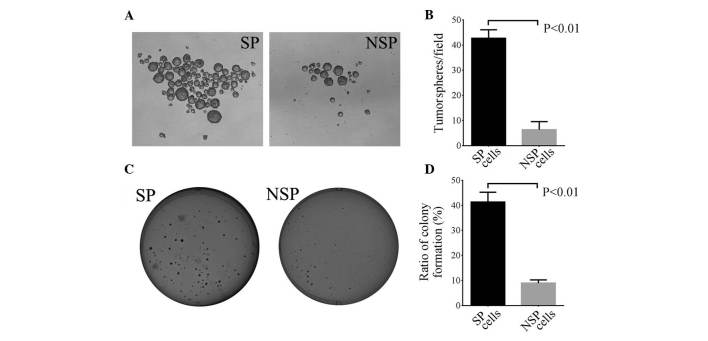
Tumorsphere and colony formation of SP and NSP cells. (A) Representative images of tumorsphere formation from SP (left panel) and NSP (right panel) cells. (B) Average number of tumorspheres/field in SP and NSP cells. Spheres >50 µm in size were counted (P<0.01; n=3). (C) Representative images of colony formation from SP (left panel) and NSP (right panel) cells. (D) Colony formation efficiency in SP and NSP cells. Clusters of >50 cells were counted (*P<0.01; n=3). SP, side population; NSP, non-SP.

