Figure 4.
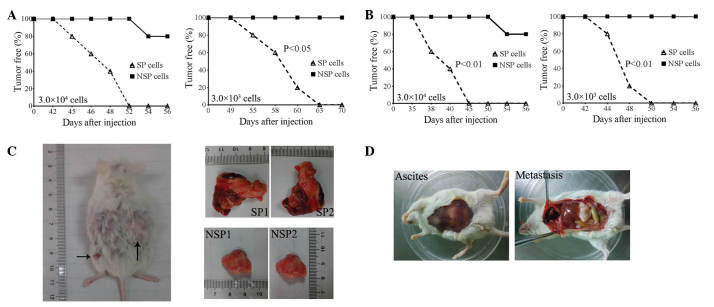
SP and NSP cell tumor formation. (A) Tumor-free curve in NOD/SCID mice following a (A) subcutaneous injection or (B) intraperitoneal injection of 3.0×10⁴ or 3.0×10³ SP and NSP cells (n=5; P-value from log rank test). Xenografted tumor characteristics from SP and NSP cells. (C) 3.0×10⁴ SP and NSP cells were subcutaneously injected into NOD/SCID mice and xenografted tumors were observed in SP and NSP groups following 56 days (left panel). The tumor size from SP cells (top right panels) was significantly larger compared with that in the NSP cells (bottom right panels). (D) 3.0×10³ SP and NSP cells were intraperitoneally injected into NOD/SCID mice. Blood ascites (left panel) and clear metastasis (right panel) in the abdominal cavity were observed in the SP group following 42 days. SP, side population; NSP, non-SP; NOD/SCID, non-obese diabetic/severe combined immune deficiency.

