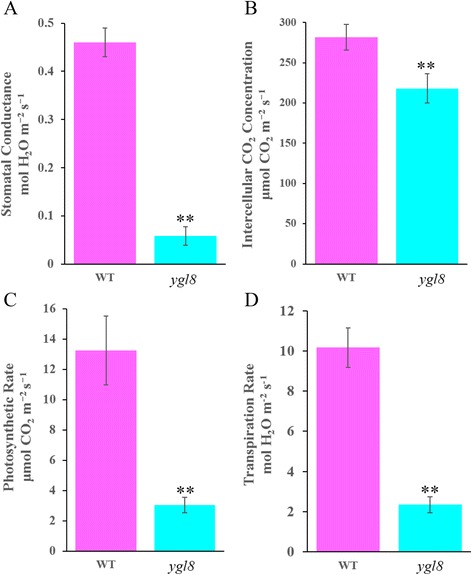
Fig. 3.

Comparison of stomatal conductance, intercellular CO2 concentration, photosynthetic rate and transpiration rate between WT and ygl8 at the heading stage. Error bars represent standard deviation (SD) of three biological repeats; ** indicates significantly different compared with the corresponding WT at p < 0.01 by the Student’s t test
