
Figure 2.
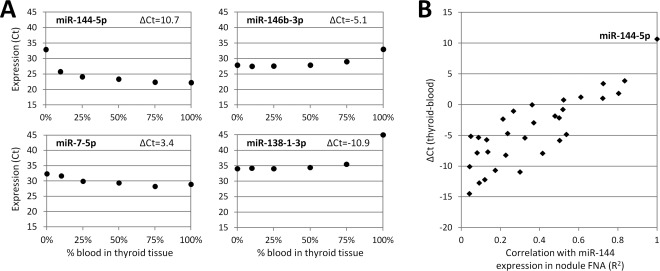
Impact of blood contamination on miRNA expression signatures. (A) Representative examples of miRNA expression levels (Ct) according to the percentage of blood contamination. Nucleic acids from resected thyroid samples (0%) were mixed with nucleic acids from blood samples (100%) to mimic clinical samples contaminated with 10, 25, 50 or 75% of blood. miR‐144‐5p was highly over expressed in blood relative to resected thyroid tissue (ΔCt=Ct 0% − Ct 100% >10), which was confirmed by microarray differential analyses (data not shown). (B) Relationship between miRNA expression difference in whole blood relative to resected thyroid tissues determined in Figure 2A (ΔCt, y axis) and the correlation between the Ct of each miRNA with the Ct of miR‐144‐5p measured in 235 preoperative thyroid nodule aspirates (R 2, x axis). In this experiment, the correlation of a given miRNA with miR‐144‐5p in nodule aspirates is taken as a proxy for the degree to which the miRNA's expression measurement is influenced by blood contamination. Abbreviation: FNA, fine‐needle aspiration.