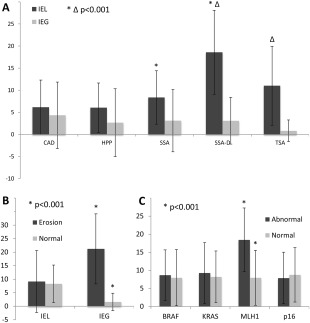
Figure 2.

Micro‐environment of the inflammatory background in CAD; HPP; SSA, SSA‐D and TSA. (A) Hot spot single counts of IELs and IEGs per high power field. Note the steady increase in IELs from HPP to SSA to SSA‐D, whereas IEG levels remain basal. The differences between SSA and SSA‐D and between SSA‐D and TSA are highly significant. (B) To exclude an influence of superficial erosions on the results, we tested the dependency of IEG and IEL counts on erosions across all polyps. Whereas IEGs rose significantly if erosions were present, IELs remained stable. In (C), the IEL status is linked directly to molecular profiles irrespective of the underlying diagnosis. Of note, MLH1 hyper‐methylation is significantly related to the IEL response. Unpaired Student's t‐tests, values are outlined as means with error bars of one standard deviation. BRAF, BRAF mutation; KRAS, KRAS mutation; MLH1, MLH1 methylation; p16, CDKN2A methylation
