
Figure 4.
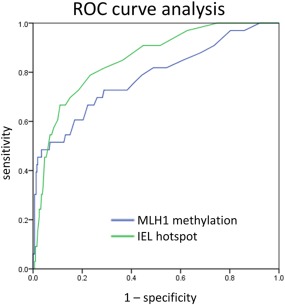
ROC curve analysis of MLH1 and IEL accuracy. Direct comparison of ROC curves of MLH1 hyper‐methylation and IEL counts and their diagnostic potential to detect SSA‐D. The ROC curve of MLH1 methylation revealed an AUC of 0.779. The ROC curve of IELs was slightly better with an area of 0.861 under the curve. Both parameters were highly significant (p < 0.001).