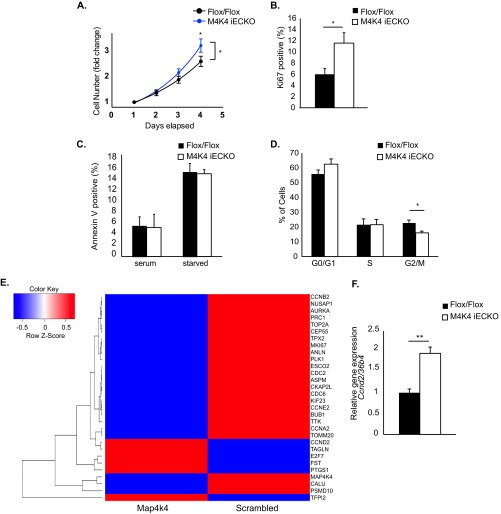
FIG 4.
Enhanced proliferation in ECs lacking Map4k4. (A to D and F) Primary MLECs were derived from chow-fed Flox/Flox or Map4k4 iECKO mice. (A) MLECs were plated at subconfluence and counted daily. The cell counts were normalized to that of day 1 and expressed as fold change. (ANOVA; *, P < 0.05; n = 7 to 11). (B) Ki67 staining in MLECs as assessed by flow cytometry (*, P < 0.05; n = 6 or 7). (C) Annexin V staining in serum-fed or serum-starved MLECs as assessed by flow cytometry (n = 6 or 7). (D) The cell cycle was assessed by BrdU and 7-AAD staining using flow cytometry (G0/G1, BrdU− 7-AAD−; S, BrdU+; G2/M, 7- AAD+; *, P < 0.05; n = 6). (E) HUVECs were transfected with scrambled or Map4k4 siRNA, the cells were serum starved overnight, and a microarray analysis was performed. The heat map represents 30 of the most up- or downregulated genes after Map4k4 knockdown (|fold change| > 1.5). (F) Ccnd2 expression was assessed in MLECs by qRT-PCR and normalized to that of 36b4 (**, P < 0.005; n = 6). The error bars represent standard errors of the mean.

