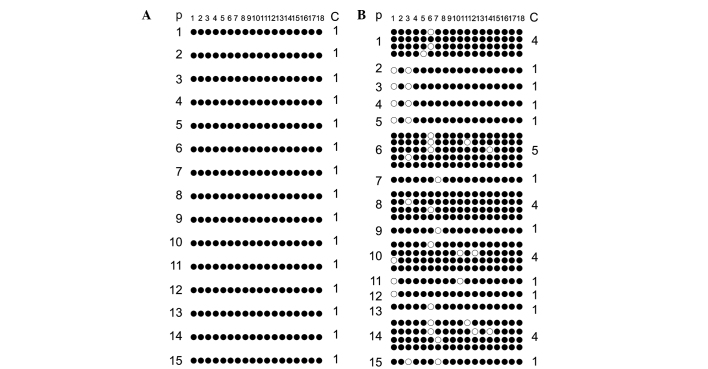
Figure 3.
Methylation scattergram of each H19 DMR CpG locus. Methylation status of the H19 DMR CpG locus in the (A) fertile and (B) infertile males. Numbers 1–18, CpG locus; P, individual; C, total number of clones in each pattern of methylation; ●, methylated CpG locus; ○, unmethylated CpG; DMR, differential methylation region.

