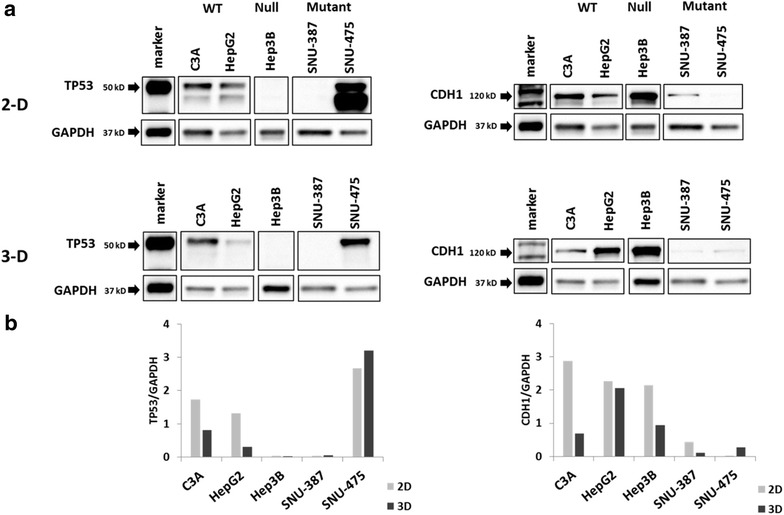
Fig. 10.

Western blotting in 2-D and 3-D cell cultures: a maximal TP53 protein expression is noted in TP53 mutant SNU-475 while maximal CDH1 expression is observed in the TP53-null cell line, Hep3B (see text for explanation). The patterns are consistent in 2-D and 3-D cultures. An additional band is observed in SNU-475 in 2-D which probably represents the β and γ isoforms of TP53 corresponding to 48 and 47 kDa sizes respectively. GAPDH was used a loading control. b Band intensities for TP53 (left) and CDH1 (right) normalized to corresponding GAPDH control. 2D and 3D ratios show some slight variation due to the inherent variability associated with quantification of western blot intensities
