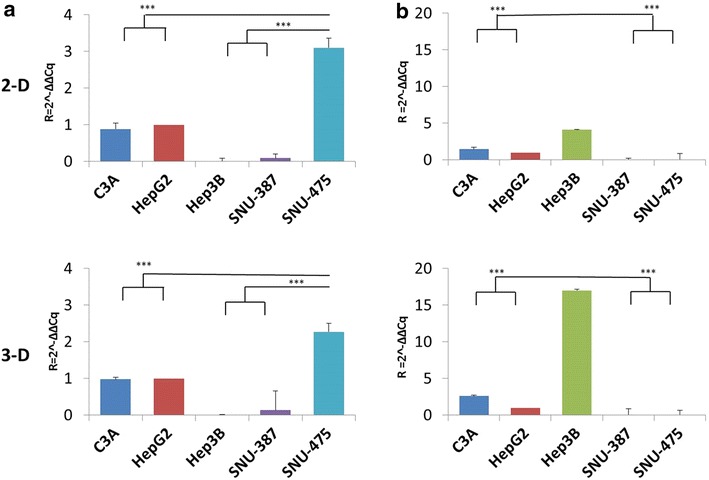
Fig. 9.

Quantitative real-time PCR: mRNA gene expression of TP53 and CDH1 genes in all five cell lines. Relative expression normalized to the value of the HepG2 (wt) cell line. a TP53 gene expression: The TP53-wt cell lines, C3A and HepG2 show intermediate levels of expression. There is overexpression of TP53 in the SNU-475 mutant cell line (see text). Minimal to no expression is observed in SNU-387 and TP53-null Hep3B cell lines. Similar patterns of expression is observed in both 2-D and 3-D cell cultures. b CDH1 gene expression: The TP53-null cell line, Hep3B shows maximal expression of CDH1 mRNA in 2-D and 3-D cultures. The TP53 wild-type cell lines show intermediate expression, while the TP53-mutants show minimal to absent expression of CDH1. ***indicates a significant difference between the compared cell lines at a 99 % level statistical significance using a paired t test (P-value ≤ 0.01)
