
FIG 3.
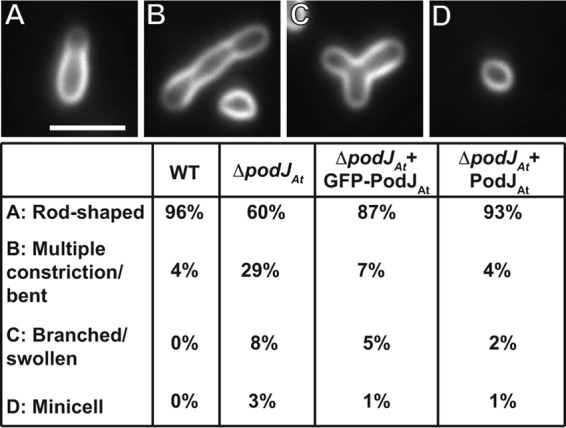
Frequency of morphological abnormalities in ΔpodJAt cells. Percentages of WT cells (n = 283), ΔpodJAt cells (n = 262), ΔpodJAt cells expressing GFP-PodJAt (n = 340), and ΔpodJAt cells expressing PodJAt (n = 247) displaying different morphologies are shown below representative images. Bar, 3 μm.