
FIG 6.
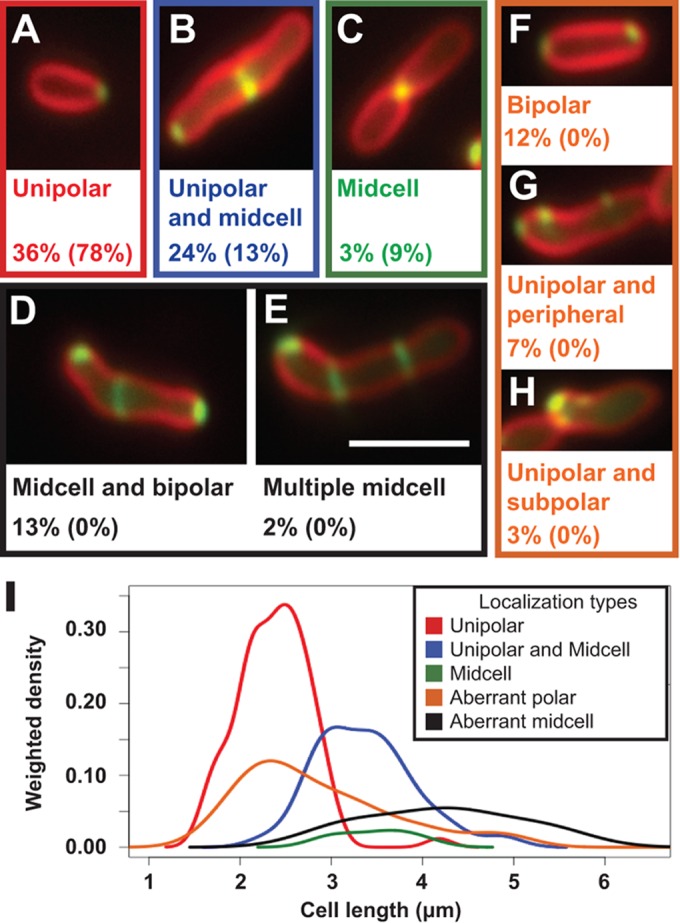
FtsA-GFP localizes in polar foci, lateral foci, and rings in elongated ΔpodJAt cells. ΔpodJAt cells expressing FtsA-GFP stained with FM4-64 display FtsA-GFP patterns seen in WT cells: unipolar (A), unipolar and midcell (B), and midcell (C) localizations. ΔpodJAt cells also display localization patterns of FtsA-GFP not observed in WT cells: bipolar and midcell (D), multiple rings (E), bipolar (F), polar and lateral foci (G), and polar clusters (H). The percentages of ΔpodJAt cells (out of 234 cells total) showing these localization types are shown under representative images, and the percentages of WT cells showing these localization types are shown in parentheses and are from reference 12. Bar, 3 μm. (I) Gaussian kernel density estimates of the distribution of cell lengths of ΔpodJAt cells with different FtsA-GFP localization patterns. Density estimates were weighted by the proportion of cells displaying the different localization types so that the height of the peaks corresponds to the proportion of cells displaying each localization pattern. Colors of density curves correspond to color outlines of representative images of each localization pattern in panels A to H. Bar, 3 μm.