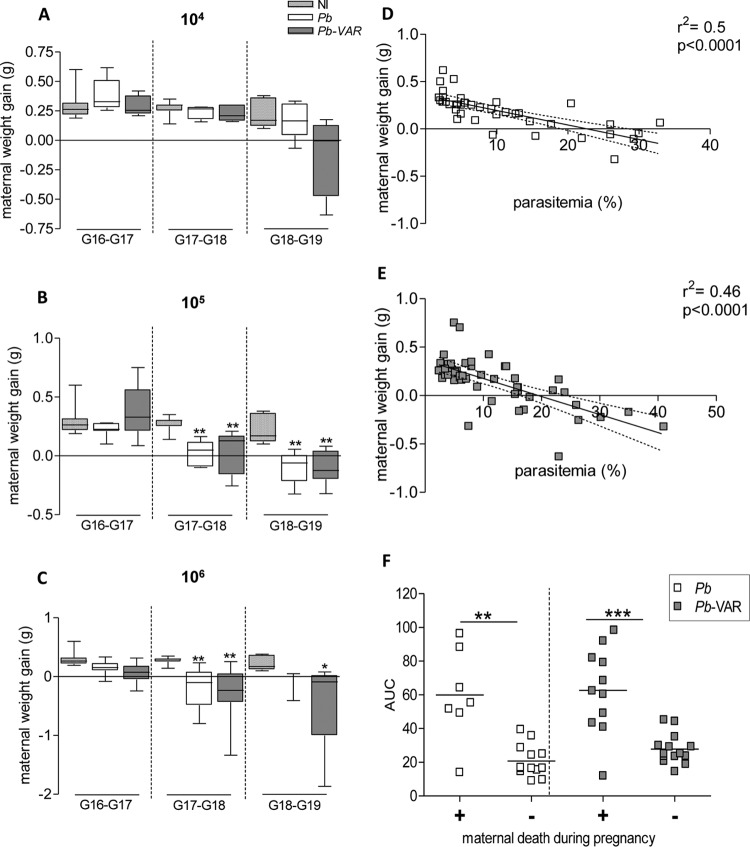
FIG 7.
Maternal weight gain correlates with parasitemia in both P. berghei-VAR- and P. berghei-infected mice. (A to C) Daily maternal weight gain (normalized by the number of fetuses) from G16 until G19 in P. berghei- or P. berghei-VAR-infected mice with different IE doses. (D and E) Scatterplots displaying pairwise data points of parasitemia and maternal weight gain across G16 to G19 revealing negative correlation in P. berghei (D)- and P. berghei-VAR (E)-infected mice. The dotted line indicates the 95% confidence interval. (F) Parasitemia (AUC) of mice that died before delivery (+) or that delivered (−) (each square represents one mother). (B and C) *, P < 0.05, and **, P < 0.01 in comparison to noninfected mice (Kruskal-Wallis with Dunn's multicomparison test). (F) The horizontal lines indicate medians; **, P < 0.01; ***, P < 0.001 (Mann-Whitney test).

