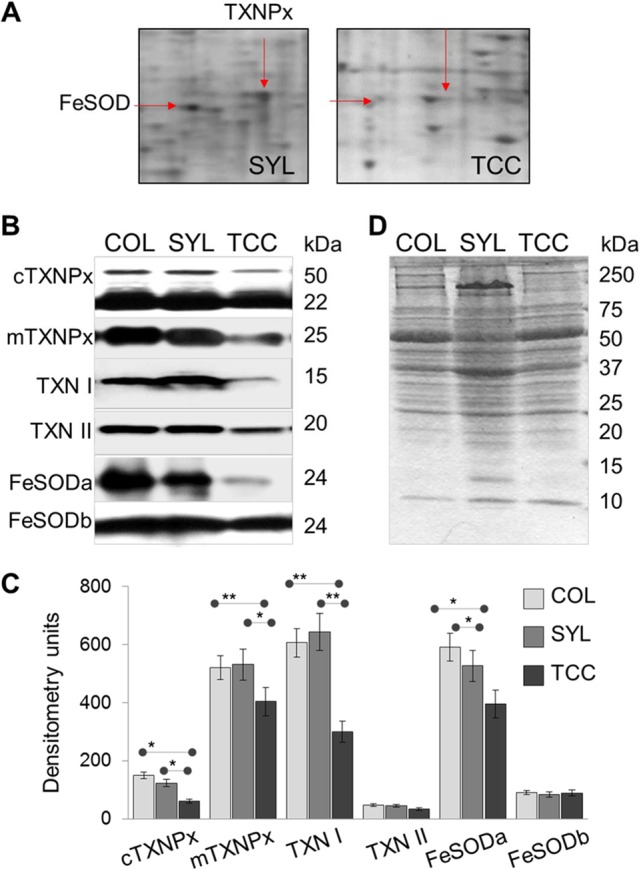
FIG 5.

Validation of expression profile of selected proteins of the antioxidant network in the trypomastigote stage of TcI strains. (A) Expanded views of the corresponding spots for TXNPx (23 kDa) and FeSOD (21 kDa) from representative 2D gel images of SYL and TCC trypomastigotes are shown. (B) Homogenates of COL, SYL, and TCC trypomastigotes were resolved by SDS-PAGE. Membranes were probed by using specific antibodies against mitochondrial and cytosolic tryparedoxin peroxidases (mTXNPx and cTXNPx, respectively), tryparedoxin substrates (TXN I and TXN II), and Fe2+ SODs (FeSODa and FeSODb). (C) The band intensities from Western blot images were digitized and normalized to total protein loaded. (D) Ponceau S staining shows equal loading of all samples.
