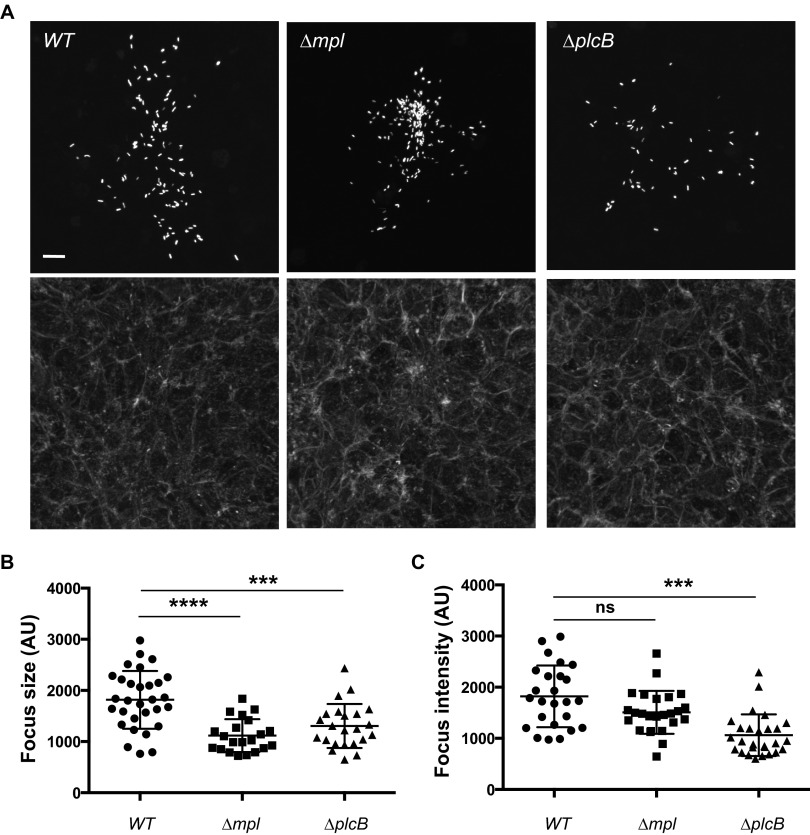
FIG 1.
Characterization of the infection foci formed in cells infected with the wild type (WT) or the mpl or plcB mutant. (A) Representative images showing monolayers of confluent HeLa 229 cells infected with GFP-expressing L. monocytogenes for 6 h (top, GFP-expressing bacteria; bottom, phalloidin staining). Bar, 10 μm. (B) Sizes of the infection foci (AU, arbitrary units) as determined by computer-assisted analysis of images like those shown in panel A. One-way analysis of variance (ANOVA) with Tukey's posttest: Δmpl versus WT strain, P < 0.0001 (****); ΔplcB versus WT strain, P < 0.001 (***). (C) Average GFP intensity per infection focus as determined by computer-assisted analysis of images shown in panel A. One-way ANOVA with Tukey's posttest: Δmpl versus WT strain, not significant (ns); ΔplcB versus WT strain, P < 0.001 (***).

