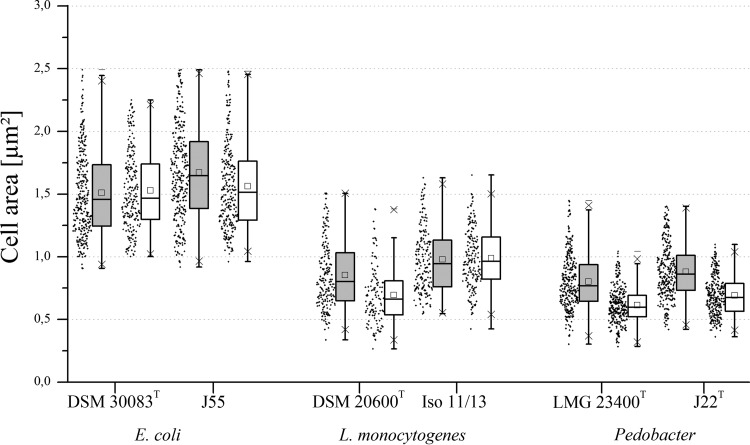
FIG 2.
Cell areas of E. coli, L. monocytogenes, and Pedobacter strains in complex medium. Comparison of the cell sizes based on cell areas in square micrometers at 30°C (gray boxes) and 10°C (white boxes). Graphical representation of key values, such as mean, median, standard deviation, and maxima, from summary statistics via box plots (each data set, n = 200 to 300). Dots to the left of the box plots represent the distribution of the measured data values.

