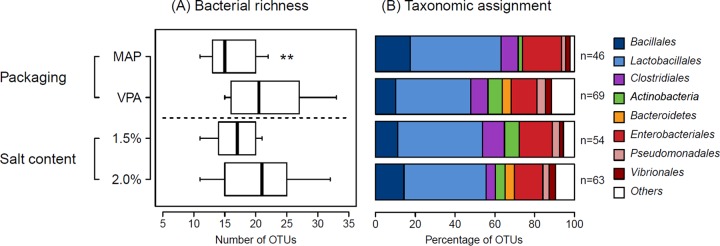
FIG 4.
(A) Box plot showing the average number of OTUs (bacterial richness) identified in spoiled sausages according to salt content and packaging conditions (all samples combined). In the plots are marked the median (bold line) and the interquartile range (box) between the first and the third quartiles obtained from the 10 samples for each condition. Asterisks indicate that samples deviated significantly from the average (P < 0.02, two-tailed t test). (B) Bar plots representing the taxonomic assignments of OTUs according to salt content and packaging conditions. The total number of OTUs for all samples under each condition is indicated on the right of the bar plot. Only the most dominant bacterial orders obtained in this study are specifically indicated; others are grouped in “Others.”

