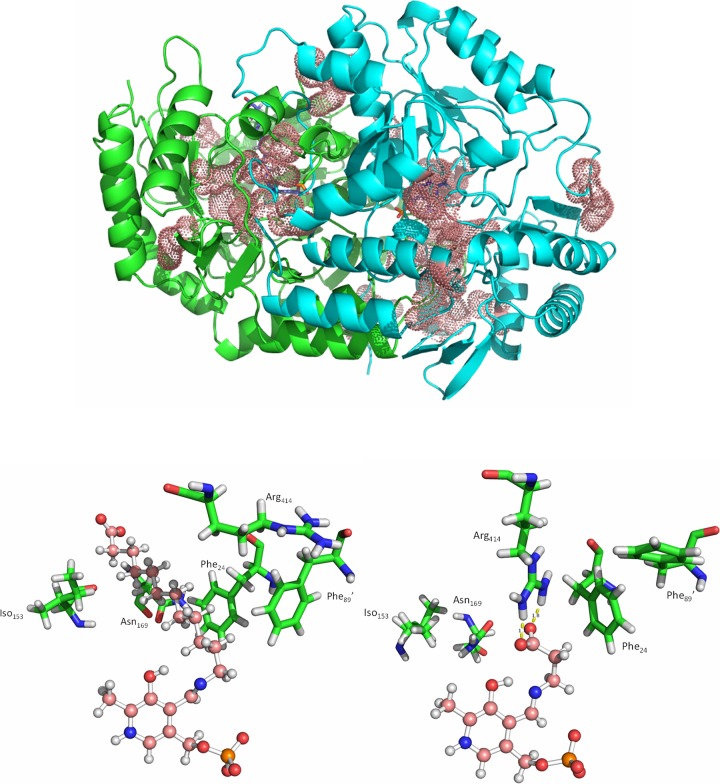
FIG 3.
(Top) The dimeric form of KES23458, with monomers shown in green and cyan. Residues which were identified as having a difference in average backbone RMSD of >1.5 Å between the two MD simulations are represented by pink dots. Note that in each case the substrate was docked into the same (green) monomeric subunit, and PLP alone was docked into the cyan monomeric subunit. (Bottom) Visualization of the active site when 12-aminododecanoic acid (structure on left) and β-alanine (structure on right) were docked independently. In each case, the substrate:PLP complex is shown in pink in a ball-and-stick representation. Residues which were observed to change conformation most significantly are shown in green.

