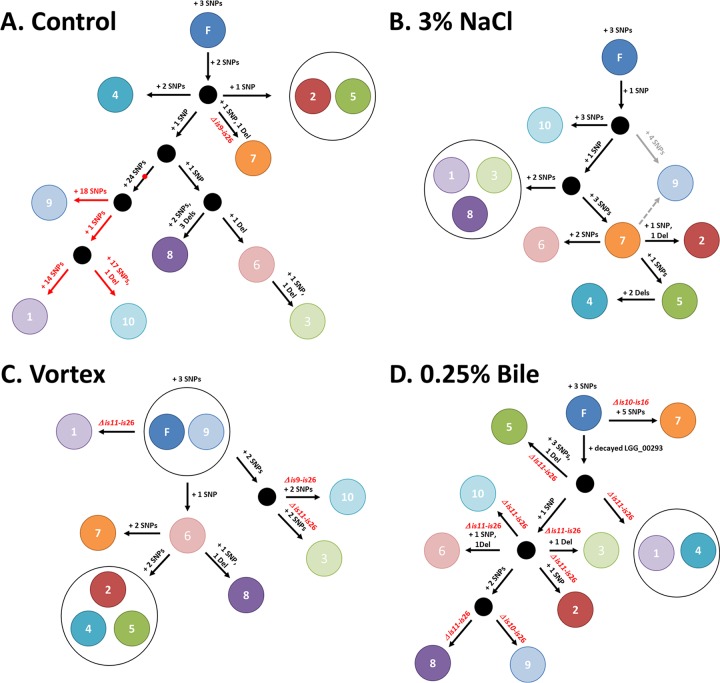
FIG 5.
Tree reconstructions of the 40 resequenced L. rhamnosus colonies recovered after culturing for 1,000 generations. The proposed trees were constructed using the output analysis of the resequenced isolates and highlight possible scenarios that may have occurred toward the diversification of the L. rhamnosus population under each condition tested. For each experiment, isolates are shown as a circle with its corresponding number. (A) The red dot highlights a SNP within the gene encoding the DNA polymerase III, δ unit, of isolates C1, C9, and C10. The subsequent mutator lineage is shown with red arrows. (B) The phylogeny of isolate N9 is unclear, and two possible scenarios (gray arrows) are plausible based on the genomic data. IS-mediated chromosomal deletions are indicated in red on the schematics. (C) Three of 10 isolates underwent IS-mediated chromosomal deletions. (D) All 10 isolates lost a large chromosomal region containing the spaCBA-srtC1 pilus gene cluster and also had a decayed gene (LGG_00293). F, founder.

